BASHIBA PANORAMA
2015 : OpenCapital Real-Time Data Climate. 3D Data Metaphor of Stock-Market Data. Real-Time Software Environment: #vvvv.org
In a participative environment where knowledge is shared, solutions to emerging problems come at a faster pace.
We deliver elegant peripheral awareness solutions that combine system awareness and mutual awareness with other users.
BASHIBA Panorama, presented here, shows the opening of the Standard & Poor market index of the US stock market during the Black Monday of the 24th of August 2015. The changes in the Standard & Poor Index, the volatility and anxiety of the market are expressed in ocean waves, cloud transformations, wind and sun strength, thus forming a single, moving image. We are not outside observers of this ocean landscape, but are catapulted over it in a flight pattern, whose height and speed equally represent market performance, and remind us in an emotional way what flying above stormy water could feel like. In this way we enable the viewer to have an emotional experience of market risk (systematic risk).
>> Roberto Vitalini Presentation at "DID" Denken in Dimensionen | Zug | 25 09 2025
Metaphern machen Komplexität lesbar. Wenn Finanzmärkte oder IT-Systeme als Wetter und Wellen sichtbar werden, verlieren Expertinnen trotz all dem Detailwissen das Gefühl für die grossen Bewegungen nicht und Nicht-Experten können Risiken und Muster intuitiv verstehen.
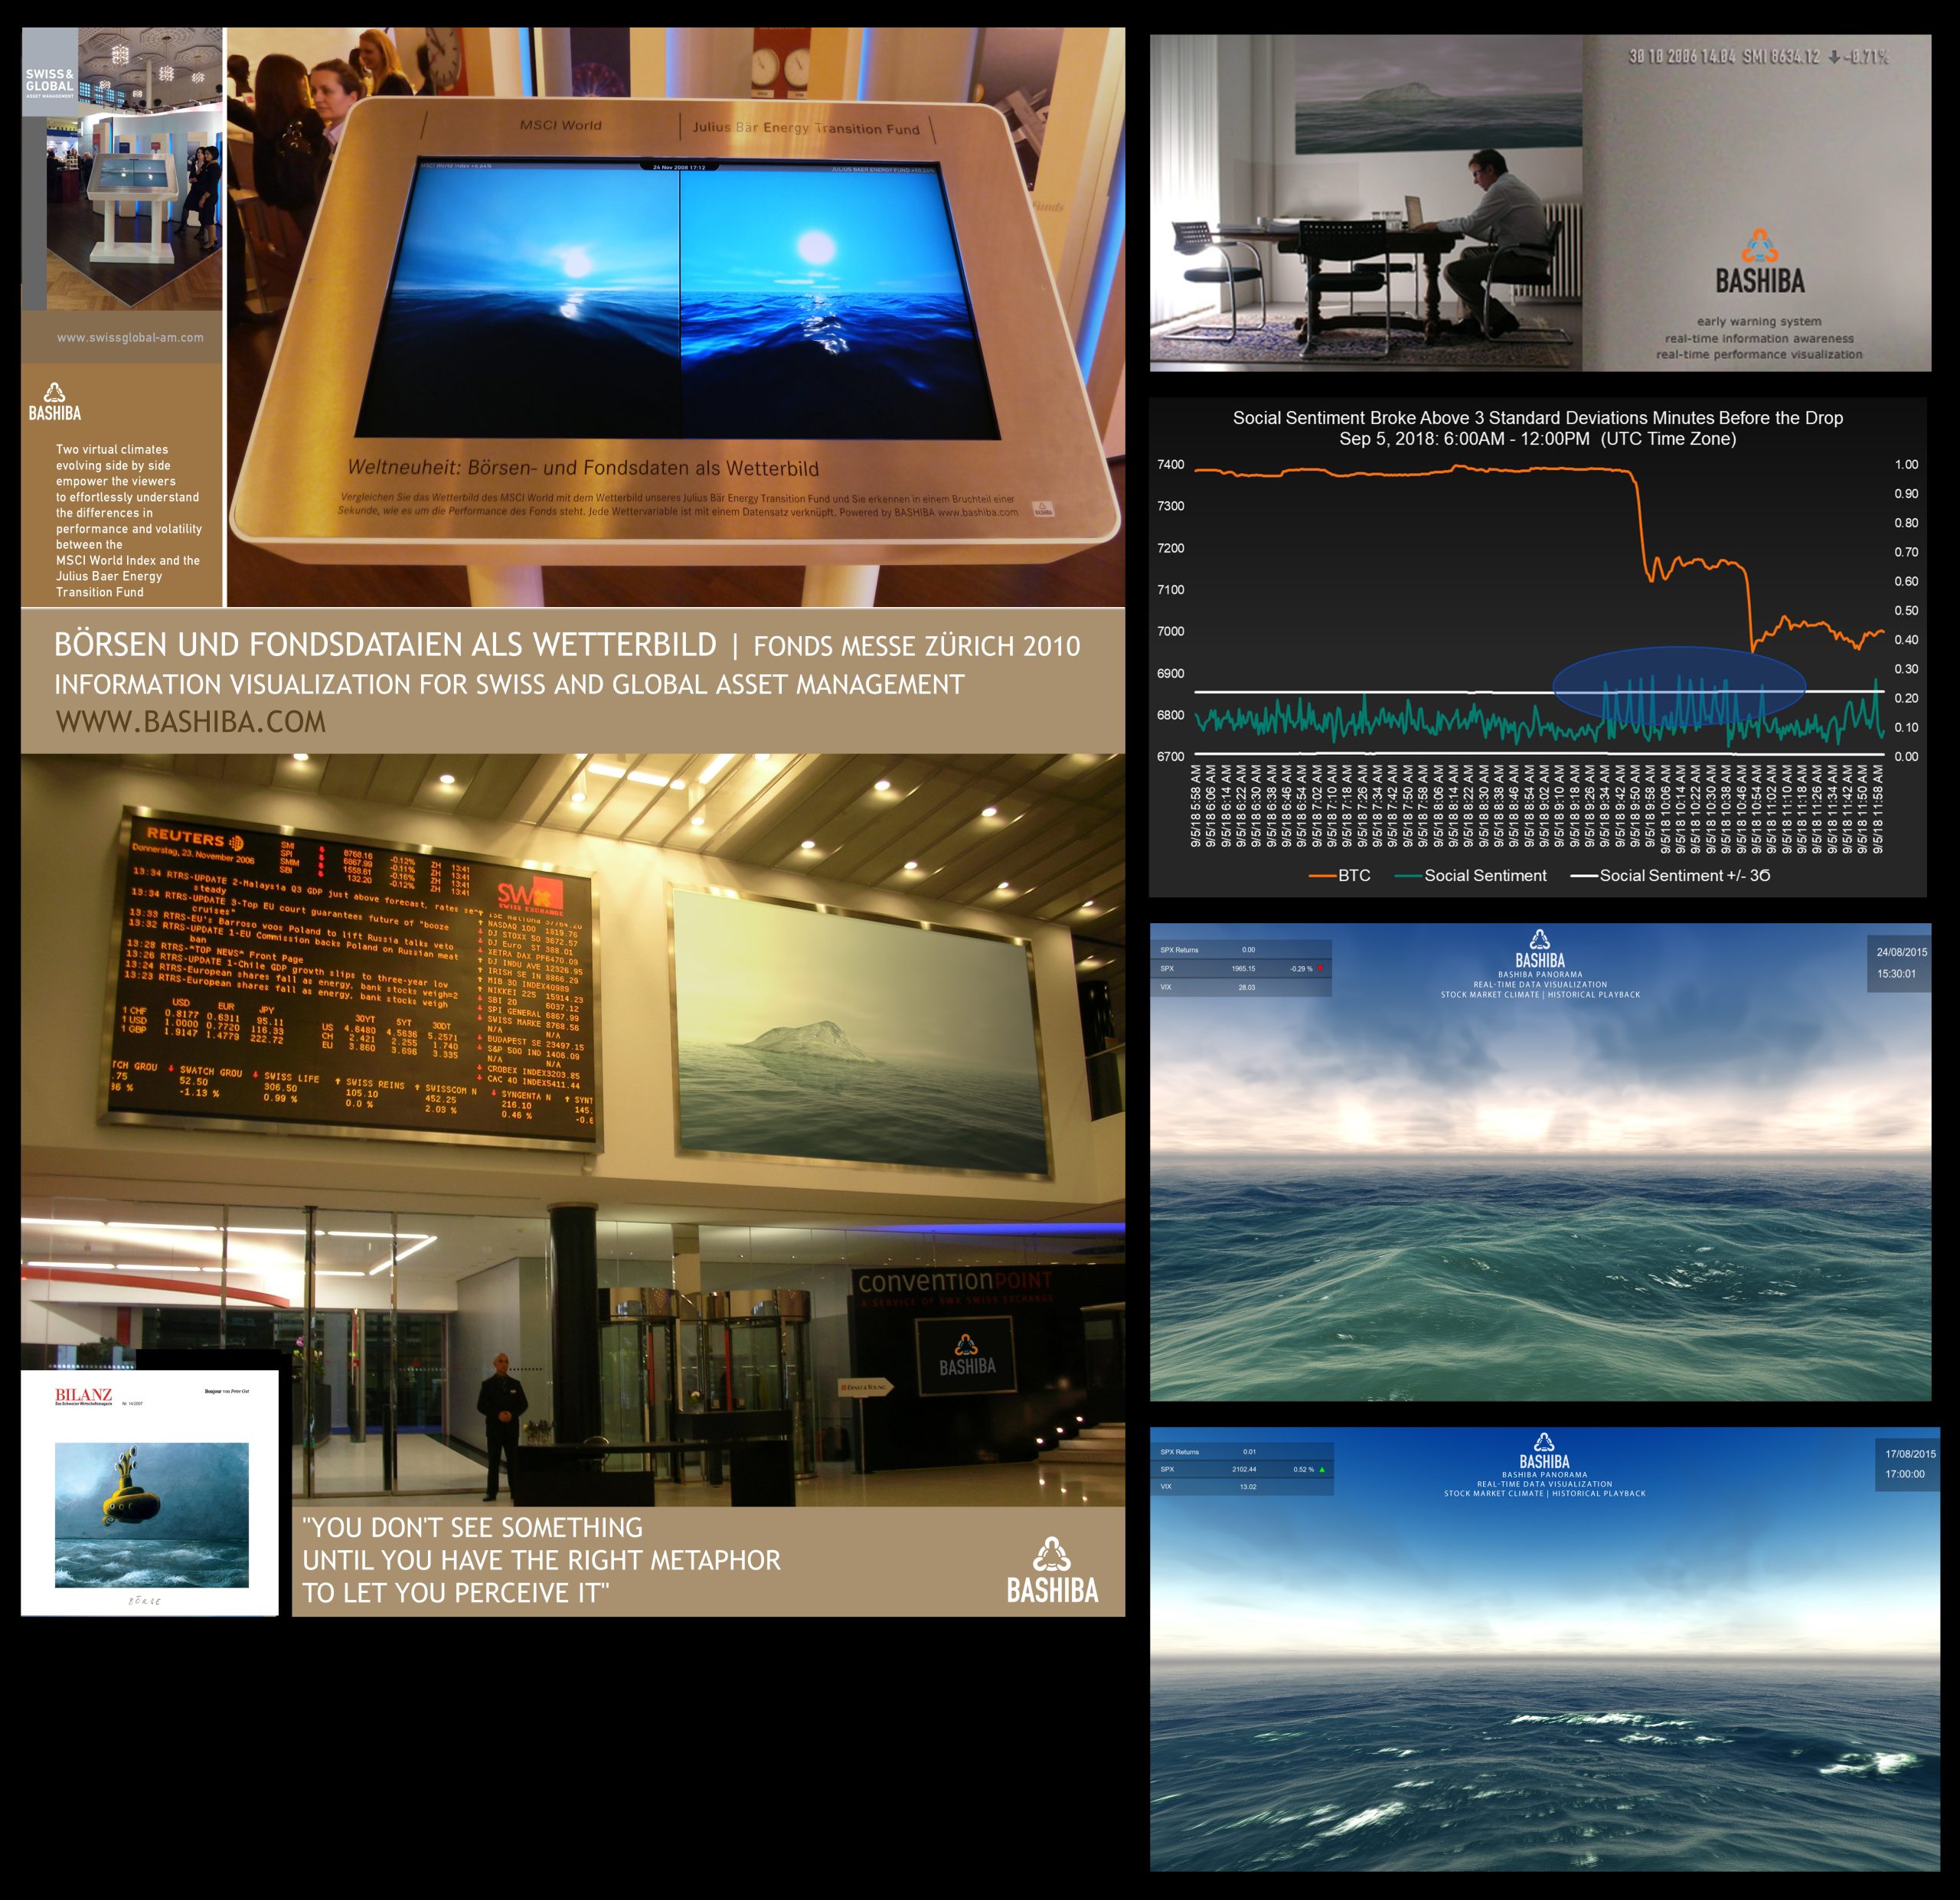
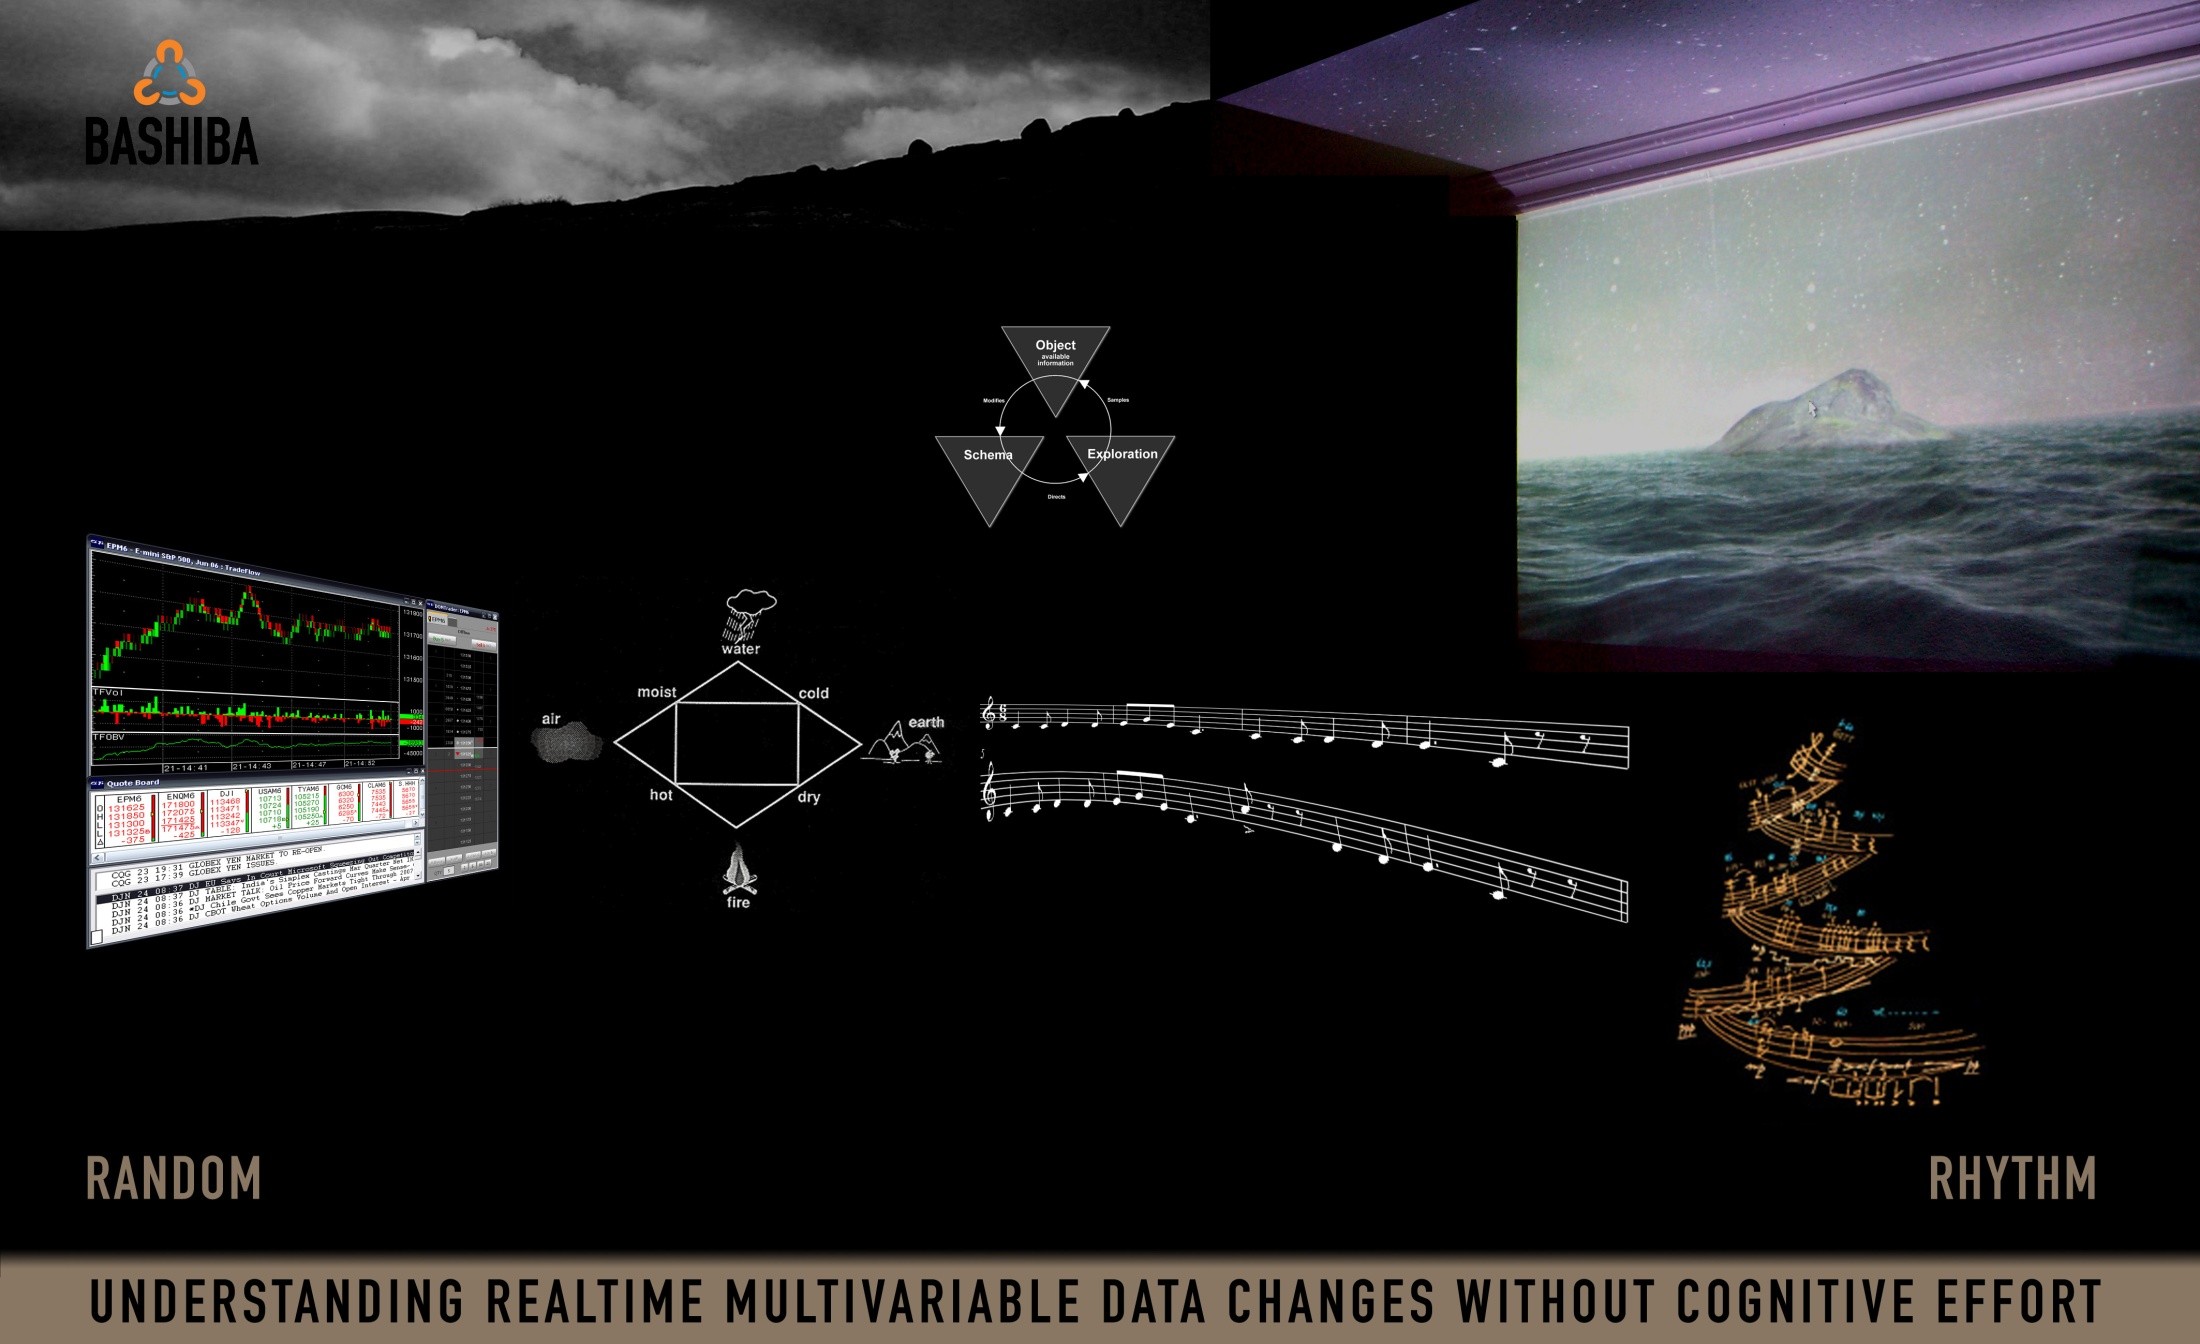
We started in 2008 to connect data streams (could be sound, financial data, EEG) to competing environmental forces that affect a real-time 3D scenery in subtle and often surprising ways. Trends and eventual problems appear as anomalies in the weather conditions or the surface of the sea. We call this approach BASHIBA Panorama, a real-time data viz solution that is instinctively legible and transits emotional sensations together with vital information.
"A cloud masses, the sky darkens, leaves twist upward, and we know that it will rain. We also know that after the storm, the runoff will feed into groundwater miles away, and the sky will grow clear by tomorrow. All of these events are distant in time and space, and yet they are all connected within the same pattern. Each has an influence on the rest, and influence that is usually hidden from view. You can only understand the system of a rainstorm by contemplating the whole, not any individual part of the pattern.
Businesses and other human endeavors are also systems. They, too, are bound by invisible fabrics of interrelated actions, which often take years to fully play out their effects on each other. Since we are part of that lacework ourselves, it's doubly hard to see the whole pattern of change. Instead we tend to focus on snapshots of isolated parts of the system, and wonder why our deepest problems never seem to get solved."
(Peter Senge, The Fifth Discipline, 1990, p.10).
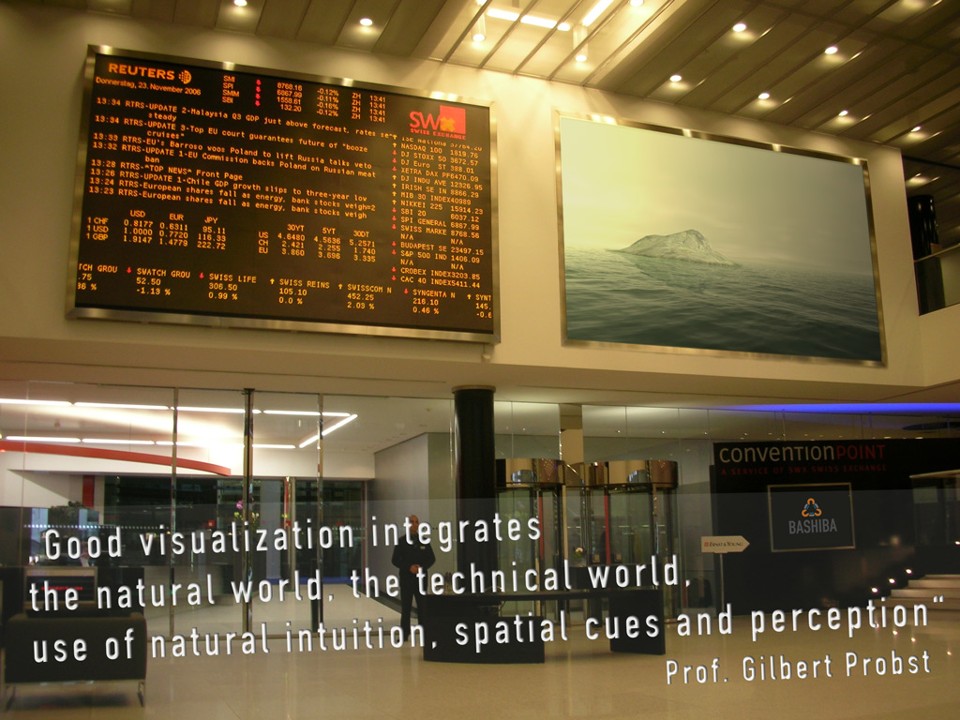
In business environments, we tend to double-check and re-read variables that in moments of crisis might be irrelevant. BASHIBA Panorama has been built as a natural visual complement so that you and your team can share a common picture of reality and openly discuss counter-measures. The result is a beautiful, developing scene in which observers (e.g. traders) can monitor several streams of background information using their peripheral vision.
BASHIBA PANORAMA : FROM RANDOM TO RHYTHM
By visualizing complex data sets through metaphoric language, formerly indiscernible relations, developments, and risks become perceivable.
BASHIBA original vision was to offer companies the possibility to have virtual windows on a beautiful landscape that reacts in real-time to data changes:
- Perceive Trend Changes with your Peripheral Vision
- Reduce Cognitive Load
- Feel the Mood of Your Information Environment
- Increase Awareness and Responsiveness
- Avoid Paralysis by Analysis (information overload)
19.08.2016 Real-Time EEG Data Visualization + Sonification
BASHIBA PANORAMA PATENT + PRESS
// 02.05.2009 K-Magazine
// 11.11.2008 BASHIBA Panorama in the Swiss Derivatives Review
// 13.09.2008 BASHIBA Panorama at "Informatica è Arte" : BASHIBA LABS @ USI - YouTube
// 26.06.2008 Google Tech Talk by Roberto Vitalini:
Real-Time Data Metaphors, understanding CHANGE without reading numbers
// 29.11.2007 Patent DE 102006024153 A1:
In Echtzeit teilnehmende oder (re-)agierende Instinkt-Kommunikations-Kanal-Hyperoberfläche
Software Development Begins
BASHIBA PANORAMA Simulation Engine by Phobyx GmbH&Co.KG | Robert Frunzke, Senior Developer
Ursprünglich 1993 als Unterhaltungssoftwareentwickler gegründet erstarb die Phobyx 1996 mit dem
Untergang der damaligen Atari Corporation (Atari ist inzwischen eine Marke der Atari Inc, zuvor bekannt
als Infogrames). 2003 erweckte der damalige Partner und heutige Geschäftsführer Gerrit Meyer das
Unternehmen erneut zum Leben, zunächst wieder als Unterhaltungssoftwareentwickler.
// 31.05.2006 BASHIBA PANORAMA IP: Patent Filed | Instinkt Kommunikations Kanal Hyperoberflaeche
SELECTED WORKS
SERVICES
video scenography
creative direction
A/V performance
generative + AI art
CONTACT US
mobile: +41 79 669 40 15

